FTDI Synchronous 245 Tutorial: D2XX with Visual Studio 2019
April 18, 2020
Perhaps the easiest way to get data between an FPGA (or microcontroller) and a PC is with a UART. It works great up to a few megabits per second, but often becomes unreliable if you push it much past that. One easy way to transfer hundreds of megabits per second is to use an FTDI chip that supports their "Synchronous 245 FIFO" protocol. It is very easy for an FPGA to implement, and I have been able to reliably transfer data to my PC at just over 350Mbps.
I used an FT232H on a "UM232H" development board from FTDI. DigiKey sells them for around $22: https://www.digikey.com/product-detail/en/ftdi-future-technology-devices-international-ltd/UM232H/768-1103-ND/
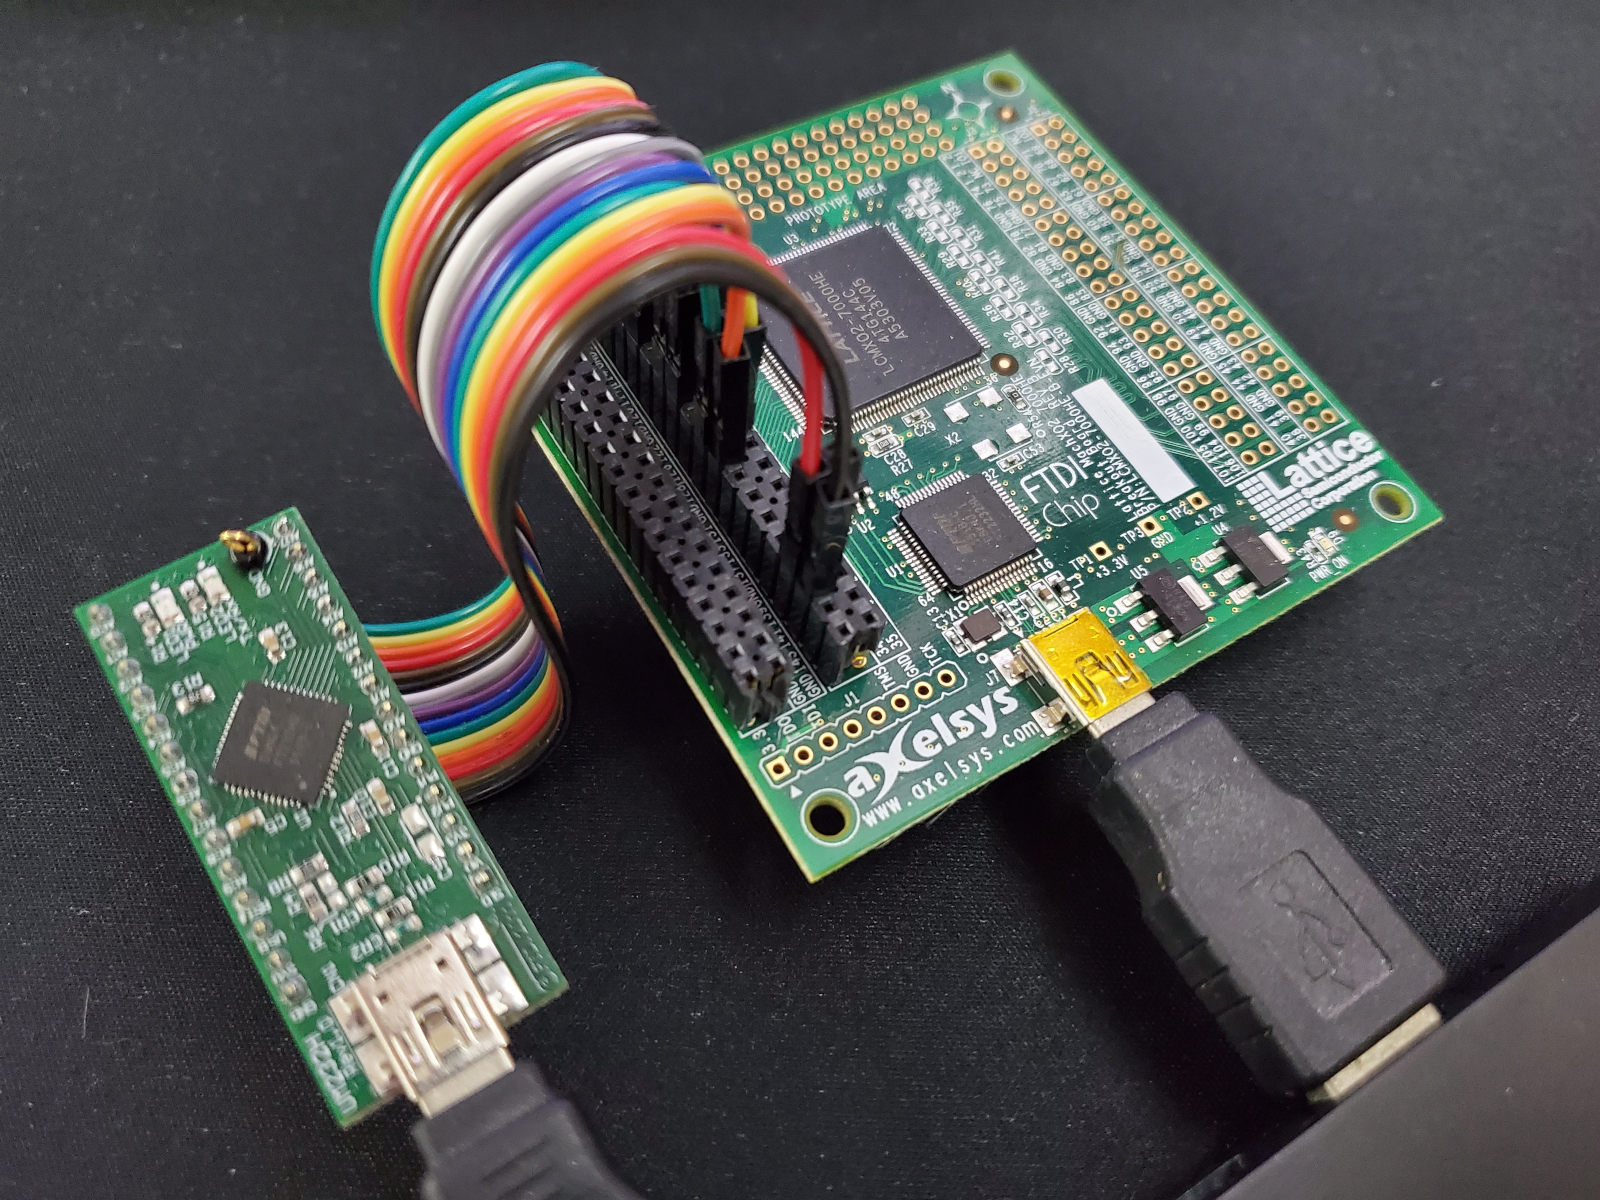
I replaced it's headers with some regular 0.1" pin headers because the factory-installed pins do not mate well with jumper wires. Here's what my setup looks like when wired to a Lattice MachXO2 FPGA development board:
Some Useful Links
https://www.ftdichip.com/Support/Documents/DataSheets/Modules/DS_UM232H.pdf
Datasheet for the FTDI development board. It summarizes the features, lists the pin out, specifies how to configure the power pins, and contains the schematic.
https://www.ftdichip.com/Drivers/D2XX.htm
To use the Synchronous 245 FIFO mode, you will need the "D2XX" driver. This might have been automatically installed when you plugged an FTDI into your PC, but you need to download this anyway, because the ZIP file contains the .lib and .h files needed when writing the software.
https://www.ftdichip.com/Support/Documents/ProgramGuides/D2XX_Programmer's_Guide(FT_000071).pdf
The D2XX Programmer's Guide explains how to use their API. It covers all of the data structures and functions that will be used.
https://www.ftdichip.com/Support/Documents/AppNotes/AN232B-03_D2XXDataThroughput.pdf
https://www.ftdichip.com/Support/Documents/AppNotes/AN232B-04_DataLatencyFlow.pdf
Applications Notes explaining how the buffers and latency timer interact, which you need to understand in order to get the best performance from the system.
https://www.ftdichip.com/Support/Documents/TechnicalNotes/TN_153%20Instructions%20on%20
Including%20the%20D2XX%20Driver%20in%20a%20VS%20Express%202013%20Project.pdf
Explains how to setup a Visual Studio project so it can use the D2XX API. This is basically the "hello world" tutorial.
https://www.ftdichip.com/Support/Documents/AppNotes/AN_130_FT2232H_Used_In_
FT245%20Synchronous%20FIFO%20Mode.pdf
Explains how to use the Synchronous 245 FIFO mode, from both a hardware and software perspective. It contains timing diagrams, demo code, some advise, etc.
Prepare a Visual Studio 2019 Project
- Open Visual Studio 2019, then create a new project:
File > New > Project > Empty C++ Project > Next > Project Name = "d2xx_test", Location = Desktop > Create - Create the main.cpp file:
Right-click the project > Add > New Item > C++ File, Name = "main.cpp" > Add - Copy the header file and library file from the D2XX Driver zip file ("CDM v2.12.28 WHQL Certified.zip" or similar) into the project's source code folder:
From the ZIP file: copy "/Static/amd64/ftd2xx.lib" and "/ftd2xx.h" into "Desktop/d2xx_test/d2xx_test/" - Update the IDE so it knows about those files:
Drag-n-drop the LIB file onto the Resource Files folder in the Visual Studio Solution Explorer.
Drag-n-drop the H file onto the Header Files folder in the Visual Studio Solution Explorer.
Right-click the project > Properties > Configuration = "All Configurations", Platform = "All Platforms" >
    Configuration Properties > C / C++ >
        Preprocessor > Preprocessor Definitions > click the "V" icon > Edit > type "FTD2XX_STATIC" > OK
        Linker > Input > Additional Dependencies > click the "V" icon >	Edit > type "ftd2xx.lib" > OK > OK
Demo Program
By now the Visual Studio project is fully setup, so you can start using the API. Below is a simple demo program I wrote. It's reads 1GB of data from the Lattice MachXO2 FPGA.
- The program starts by displaying information about each FTDI device that is attached. Keep in mind that not all FTDI devices support the Synchronous 245 FIFO protocol.
- If a device with a certain serial number is found, the program will attempt to connect, configure for FIFO mode, and read 1GB of data.
- An error message will be displayed if there are any problems, and the program will exit.
Software Source Code (C++)
#include <stdio.h>
#include <time.h>
#include "ftd2xx.h"

int main(int argc, char** argv) {

    FT_HANDLE handle;

    // check how many FTDI devices are attached to this PC
    unsigned long deviceCount = 0;
    if(FT_CreateDeviceInfoList(&deviceCount) != FT_OK) {
        printf("Unable to query devices. Exiting.\r\n");
        return 1;
    }

    // get a list of information about each FTDI device
    FT_DEVICE_LIST_INFO_NODE* deviceInfo = (FT_DEVICE_LIST_INFO_NODE*) malloc(sizeof(FT_DEVICE_LIST_INFO_NODE) * deviceCount);
    if(FT_GetDeviceInfoList(deviceInfo, &deviceCount) != FT_OK) {
        printf("Unable to get the list of info. Exiting.\r\n");
        return 1;
    }

    // print the list of information
    for(unsigned long i = 0; i < deviceCount; i++) {

        printf("Device = %d\r\n", i);
        printf("Flags = 0x%X\r\n", deviceInfo[i].Flags);
        printf("Type = 0x%X\r\n", deviceInfo[i].Type);
        printf("ID = 0x%X\r\n", deviceInfo[i].ID);
        printf("LocId = 0x%X\r\n", deviceInfo[i].LocId);
        printf("SN = %s\r\n", deviceInfo[i].SerialNumber);
        printf("Description = %s\r\n", deviceInfo[i].Description);
        printf("Handle = 0x%X\r\n", deviceInfo[i].ftHandle);
        printf("\r\n");

        // connect to the device with SN "FT3SSN2O"
        if(strcmp(deviceInfo[i].SerialNumber, "FT3SSN2O") == 0) {

            if (FT_OpenEx(deviceInfo[i].SerialNumber, FT_OPEN_BY_SERIAL_NUMBER, &handle) == FT_OK &&
                FT_SetBitMode(handle, 0xFF, 0x40) == FT_OK &&
                FT_SetLatencyTimer(handle, 2) == FT_OK &&
                FT_SetUSBParameters(handle, 65536, 65536) == FT_OK &&
                FT_SetFlowControl(handle, FT_FLOW_RTS_CTS, 0, 0) == FT_OK &&
                FT_Purge(handle, FT_PURGE_RX | FT_PURGE_TX) == FT_OK &&
                FT_SetTimeouts(handle, 1000, 1000) == FT_OK) {

                // connected and configured successfully
                // read 1GB of data from the FTDI/FPGA
                char rxBuffer[65536] = { 0 };
                unsigned long byteCount = 0;
                time_t startTime = clock();
                for(int i = 0; i < 16384; i++) {
                    if(FT_Read(handle, rxBuffer, 65536, &byteCount) != FT_OK || byteCount != 65536) {
                        printf("Error while reading from the device. Exiting.\r\n");
                        return 1;
                    }
                }
                time_t stopTime = clock();
                double secondsElapsed = (double)(stopTime - startTime) / CLOCKS_PER_SEC;
                double mbps = 8589.934592 / secondsElapsed;
                printf("Read 1GB from the FTDI in %0.1f seconds.\r\n", secondsElapsed);
                printf("Average read speed: %0.1f Mbps.\r\n", mbps);
                return 0;

            } else {

                // unable to connect or configure
                printf("Unable to connect to or configure the device. Exiting.\r\n");
                return 1;

            }

        }

    }

    return 0;

}
Firmware Source Code (Verilog)
`default_nettype none

module top (

    // ftdi 245 fifo signals
    output reg  [7:0] data,           // [7:0] = pins 1,2,3,4,9,10,11,12
    input  wire rx_empty,             // pin 13
    input  wire tx_full,              // pin 14
    output reg  read_n,               // pin 19
    output reg  write_n,              // pin 20
    output reg  send_immediately_n,   // pin 21
    input  wire clock_60mhz,          // pin 27
    output reg  output_enable_n,      // pin 28

    // status leds
    output reg power_led_n,           // pin 97
    output reg tx_active_led_n        // pin 107

);

reg [7:0] counter;

always @(posedge clock_60mhz) begin

    power_led_n <= 0;
    output_enable_n <= 1;
    send_immediately_n <= 1;

    if(!tx_full) begin
        write_n <= 0;
        data <= counter;
        tx_active_led_n <= 0;
        counter <= counter + 1;
    end else begin
        write_n <= 1;
        read_n <= 1;
        tx_active_led_n <= 1;
    end

end

endmodule
Output of Test Run
Device = 0
Flags = 0x2
Type = 0x6
ID = 0x4036010
LocId = 0x262
SN = B
Description = Lattice FTUSB Interface Cable B
Handle = 0x0

Device = 1
Flags = 0x2
Type = 0x6
ID = 0x4036010
LocId = 0x261
SN = A
Description = Lattice FTUSB Interface Cable A
Handle = 0x0

Device = 2
Flags = 0x2
Type = 0x8
ID = 0x4036014
LocId = 0x281
SN = FT3SSN2O
Description = UM232H
Handle = 0x0

Read 1GB from the FTDI in 24.1 seconds.
Average read speed: 356.5 Mbps.